📊 System Telemetry Dashboard
This dashboard displays activity spikes, telemetry heatmaps, and the timeline of major technical milestones. Every event was intentional—mapped, built, and validated.
🕰️ 25-Hour Activity Heatmap (Arizona Time)
📖 Activity Highlights
🕒 Mar 14, 2025 @ 11:00 AM AZ — 970 FrontDoor, 7 WSTcounter
🕒 Mar 14, 2025 @ 10:00 AM AZ — 783 FrontDoor, 13 WSTcounter
🕒 Apr 08, 2025 @ 1:00 PM AZ — 691 FrontDoor, 13 WSTcounter
🛠️ Build Timeline
Every milestone verified via logs or deployment artifacts.
- 🧮 Mar 10 – Visitor Counter deployed (Azure Functions + Cosmos DB)
- 🌐 Mar 12 – Front Door routing activated (custom domains, status checks)
- 📈 Mar 14 – Chaos demo: Nginx + netcat deployed, battery visual added
- 🧪 Mar 16 – Failover Frenzy game + cross-region VMs with cache fix
- 🤖 Mar 17 – Ruel’s Assistant live (Grok2-powered bot via Blob)
- 🖥️ Mar 18 – AIRuel ChatOps commands online (start/stop/ping VMs)
- 🔐 Mar 20 – Admin Panel deployed (Azure AD login)
- 💰 Mar 20 – Financial controls added (RG cost, Grok usage)
- 🚀 Mar 21 – Bulk VM commands + region outage detection finalized
- 🩺 Apr 02 – Healthcare Sync Demo online (100+ patients, 3 source merge)
- 🐛 Apr 04 – Cosmos SDK bug patched (cross-partition data visible again)
- 📡 Apr 08 – Telemetry UX finalized (graphs, recruiter-ready polish)
- 🔍 Apr 10 – RBAC Role Usage Audit tool deployed (drift detection, audit viewer, GitHub-linked)
- 🛡️ Apr 11 – MSRC vulnerability report submitted (Reader-scope infrastructure inference via logs)
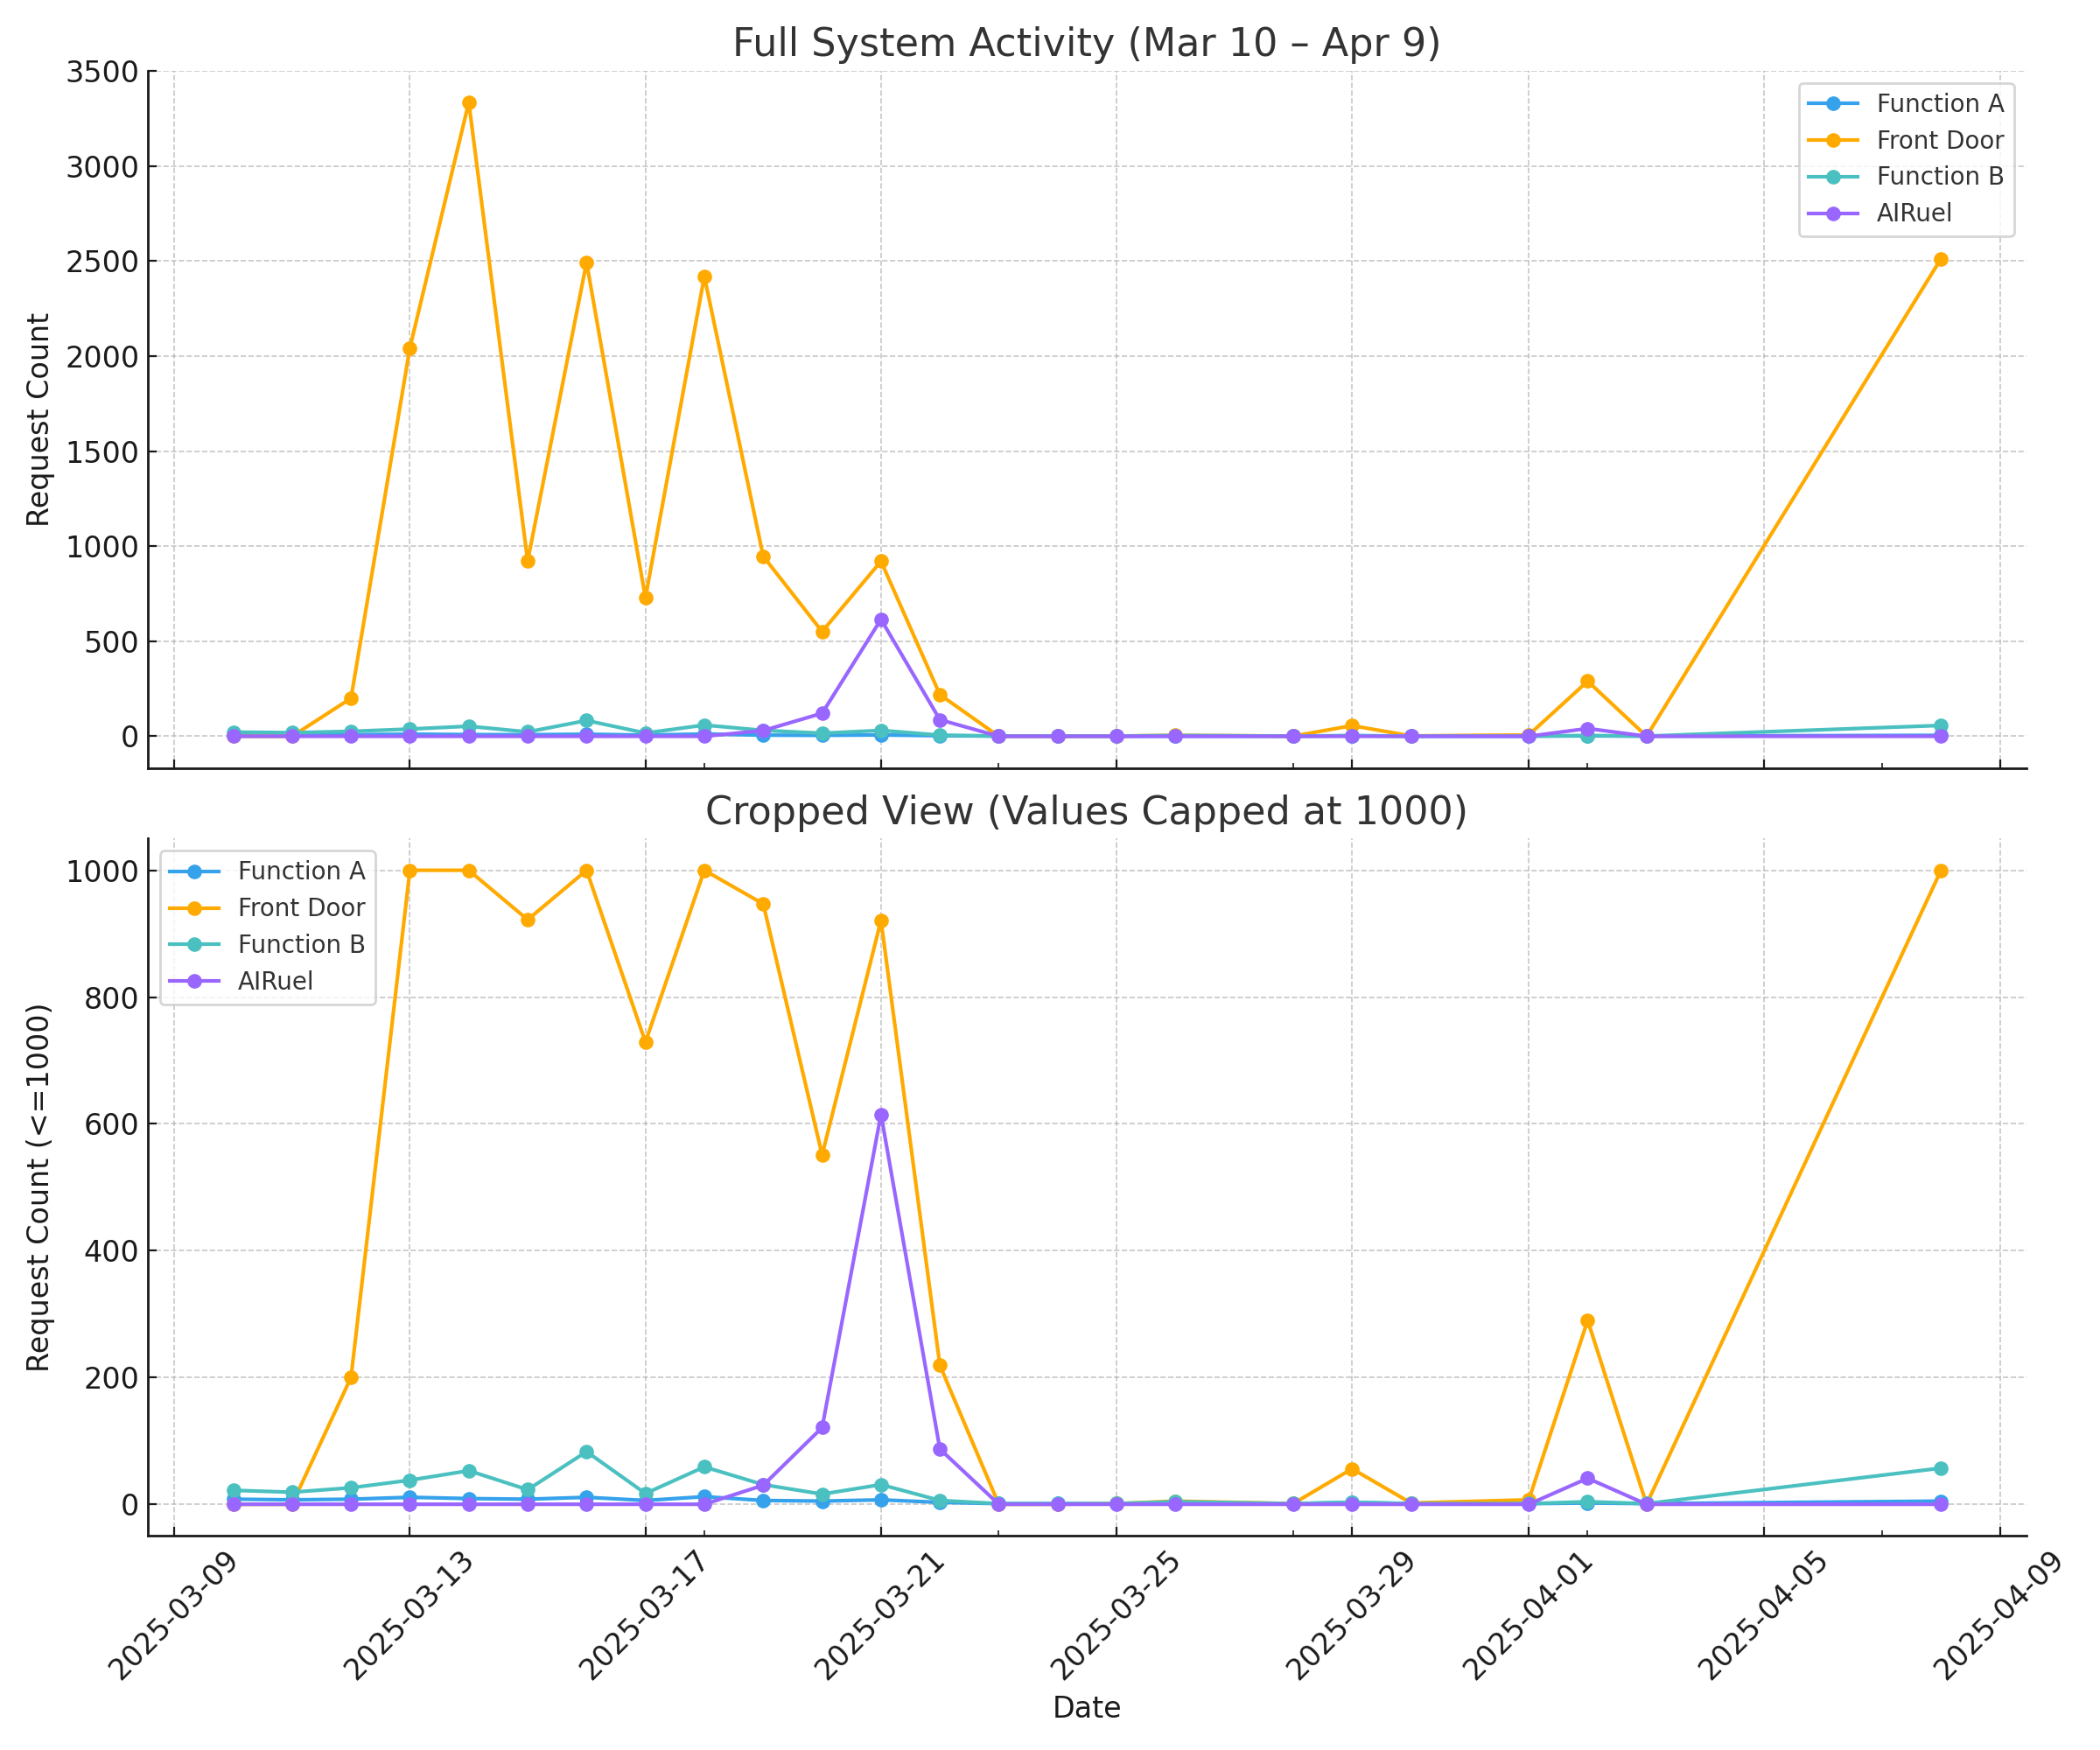
📊 Traffic vs Build Timeline
This chart overlays real request volume against the development timeline above. Use the lower pane to spot growth phases and daily rhythm that may otherwise be flattened by spike activity.
🔎 Macro Footprint
- Tracked dev activity in 189 hours over prime build weeks
- 25 chaos events (primarily 1–4 AM AZ time)
- 8+ week project, spanning 6+ regions, 3+ architectural layers
“This wasn’t random. This was orchestrated.”
📡 AIRuel Query Duration
Coming soon: Response time telemetry, performance insights, and historical trends.